.svg "CTA Arrow")


.png "Investor Ready Capital decorative background element")

What Sales Efficiency Metrics Matter Most to Growth Equity Firms at Series B?

Growth equity firms evaluate Magic Number, CAC payback, and LTV:CAC to determine whether a Series B SaaS company's revenue engine can scale efficiently. Present each metric with fully loaded inputs, explicit gross margin assumptions, and segmentation by acquisition channel, GTM motion, and ACV band. This gives investors a clear view of both near-term cash recovery and long-run unit economics before diligence begins.
This guide covers how each metric is calculated, what thresholds growth equity firms apply at the $10M to $30M ARR stage, and how to structure your efficiency presentation so analysts have no unanswered questions.
The core issue: A deteriorating Magic Number tells investors the GTM engine is outrunning its returns. Efficiency metrics reveal whether the business can scale spend and maintain those returns as capital is deployed.
Why Growth Equity Scores Efficiency Before Growth Rate
Growth equity firms write checks at $10M to $30M ARR because the GTM motion is supposed to be proven. At seed and Series A, investors tolerate inefficiency as the cost of finding product-market fit. At Series B, the question shifts entirely: can the company deploy more capital and maintain or improve its efficiency ratios?
ICONIQ Growth's 2024 SaaS metrics report identifies companies with a Magic Number above 0.75 and a burn multiple below 1.5x as the preferred investment profile for growth-stage rounds. Companies outside that efficiency zone face meaningful valuation compression relative to peers inside it.
A founder presenting 80% ARR growth with a Magic Number of 0.5 will spend the entire diligence process defending the efficiency gap. A founder presenting 60% ARR growth with a Magic Number of 1.1, segmented by channel, closes that conversation in the first meeting.
Key insight: Growth equity analysts score efficiency first because it tells them whether the round they are about to fund will produce compounding returns or simply sustain the current burn rate.
Before going to market, founders should confirm their raise package addresses the same twelve institutional gates a deal must clear before a firm takes it to committee. The Capital Raise Pre-Flight is IRC Partners' fixed-fee diagnostic that scores a raise against the same twelve institutional gates a deal must clear before IRC Partners takes it into a strategic partnership.
The Magic Number: What It Measures and Where the Bar Sits
The Magic Number measures how efficiently a company converts sales and marketing spend into new ARR. The formula is: net new ARR in the current quarter divided by total sales and marketing spend in the prior quarter.
Calculation and Interpretation
A Magic Number of 1.0 means every dollar spent on sales and marketing in Q1 produced one dollar of net new ARR in Q2. A number above 1.0 signals the GTM engine is efficient enough to justify accelerating spend. A number below 0.75 signals the current spend level is converting poorly enough that adding capital would amplify the problem.
ICONIQ Growth's benchmarks show that top-quartile companies at $10M ARR run a net Magic Number of 1.0 to 2.0, with the median closer to 0.75 to 1.0. Bessemer Venture Partners' State of the Cloud 2024 confirms the median Magic Number for venture-backed SaaS companies at $10M to $50M ARR clusters around 0.65 to 0.75, while top-quartile performers consistently exceed 1.0.
Series B Thresholds by ARR Band
Source: Bessemer Venture Partners State of the Cloud 2024; ICONIQ Growth SaaS Metrics Report 2024.
What Analysts Do With a Low Magic Number
A Magic Number below 0.75 triggers a segmentation request. Analysts look for a segmented explanation. If the blended number is 0.6 but the enterprise motion runs at 1.2 while a deprecated SMB channel drags the average down, that is a diagnosable pattern. Founders who present this segmentation close the efficiency question. Founders who present only the blended number invite a diligence deep-dive that can last weeks.
Presentation requirement: Show the Magic Number by channel (inbound, outbound, partner) and by GTM motion (SMB, mid-market, enterprise) for the trailing four quarters. Include the trend line. A recovering trajectory matters as much as the current level.
CAC Payback Period: The Cash Flow Signal Analysts Trust Most
CAC Payback measures how many months of gross margin it takes to recover the fully loaded cost of acquiring a customer. It connects directly to cash burn, runway consumption, and the pace at which the business can reinvest in growth.
How to Calculate It
Fully loaded CAC includes all sales and marketing salaries, commissions, tools, and overhead allocated to new customer acquisition. Divide that by the monthly gross margin contribution from a new customer. The result is the number of months until the customer pays back what it cost to acquire them.
Series B Benchmarks by ACV Segment
KeyBanc Capital Markets' 2024 SaaS Survey, covering 104 companies at a median of $26M ARR, found median CAC payback of approximately 20 months, down from 25 months in 2022 as companies tightened GTM spend. OpenView Partners' 2024 SaaS Benchmarks set the following expectations by ACV segment at Series B:
Source: OpenView Partners SaaS Benchmarks 2024; KeyBanc Capital Markets SaaS Survey 2024.
Why Payback Period Matters More Than the Ratio Alone
Bessemer Venture Partners' 2025 guidance explicitly states that companies presenting payback periods above 24 months face significant multiple compression even when the LTV:CAC ratio meets the 3:1 threshold. The ratio tells investors the long-run economics. The payback period tells them how long the business must operate at a deficit before each customer turns profitable.
A company with a 5:1 LTV:CAC and a 36-month payback period is a fundamentally different capital risk than a company with a 5:1 LTV:CAC and a 10-month payback period. Analysts know this. Founders who present both metrics together, segmented by ACV band, remove the ambiguity before it becomes a negotiating point.
Presentation requirement: Show payback period by ACV segment and by acquisition channel for the trailing four quarters. If payback has compressed over time, that trend line is one of the strongest signals of GTM maturation a founder can present.
LTV:CAC Ratio: The Long-Run Economics Test
The LTV:CAC ratio measures the lifetime value of a customer relative to what it cost to acquire them. It answers the fundamental unit economics question: does this business model make money on each customer, and by how much?
The Formula
LTV is calculated as average revenue per account multiplied by gross margin percentage, divided by the monthly churn rate. CAC is the fully loaded acquisition cost per new customer. The ratio of LTV to CAC tells investors whether the business generates a sustainable return on customer acquisition investment.
Series B Thresholds
OpenView Partners, KeyBanc, and Bessemer's 2025 to 2026 frameworks establish the following thresholds by stage:
The B2B median sits around 3.2:1 according to KeyBanc's 2024 survey data. Top-quartile companies at the Series B stage run 4:1 to 6:1. Enterprise SaaS with large ACVs and strong retention tends toward 4.5:1 or above.
The Ceiling Problem
ICONIQ Growth's benchmarks flag a counterintuitive risk: LTV:CAC above 6:1 can signal under-investment in growth. When the return per acquisition dollar is that high, analysts expect the company to be spending more aggressively. A very high ratio paired with a low Magic Number prompts the question of whether the company is leaving growth on the table by under-deploying in sales and marketing.
The ratio and the payback period must be read together. A 5:1 LTV:CAC with a 10-month payback is a high-confidence efficiency profile. A 5:1 LTV:CAC with a 36-month payback signals that the long-run economics are sound but the short-run cash position is fragile.
What Analysts Want to See Below 3:1
Bessemer's 2025 guidance states that a ratio below 3:1 requires gross revenue retention above 85% as a compensating factor. If both metrics are below threshold simultaneously, expect a detailed model walkthrough before any term sheet conversation begins.
Presentation requirement: Present LTV:CAC by cohort year and by ACV segment. Show the gross margin assumption explicitly. Analysts will check whether the LTV calculation uses gross margin or revenue, and a revenue-based LTV overstates the ratio materially.
Founders preparing for a Series B should also understand how cap table structure affects the raise before efficiency metrics enter the conversation. The guide on cap table issues that derail a Series B covers what gets screened before an analyst reads the first slide.
How to Build the Efficiency Slide Set That Pre-Empts Diligence
Growth equity firms ask about efficiency metrics because the answers determine whether they can model a return. Founders who build a dedicated efficiency slide set before the first meeting shift the dynamic from interrogation to confirmation.
The Three-Slide Structure
Slide 1: Blended efficiency summary. Present the Magic Number, CAC Payback, and LTV:CAC as a single summary view for the trailing eight quarters. Show the trend. Include the gross margin assumption used in each calculation. This slide answers the top-line question in 30 seconds.
Slide 2: Segmentation by GTM motion. Break each metric by channel (inbound, outbound, partner-sourced) and by ACV segment (SMB, mid-market, enterprise). This is where most founders create separation. According to ICONIQ Growth's GTM benchmark data, analysts at growth equity firms specifically look for channel-level segmentation because blended numbers can mask a deteriorating motion inside an otherwise healthy aggregate.
Slide 3: Gap diagnosis and action taken. If any metric is below the relevant benchmark, present the diagnosis and the action already taken. A Magic Number of 0.6 with a clear explanation that the SMB channel was wound down in Q3 and enterprise payback is 11 months is a manageable story. The same number with no explanation becomes a diligence thread that can run for weeks.
The Segmentation Principle
Growth equity practitioners consistently observe that founders presenting channel-segmented efficiency data move through diligence faster and receive fewer follow-up information requests than those presenting only blended metrics. Segmentation signals operational maturity. It tells analysts the leadership team knows exactly where efficiency comes from and where it does not.
Every number in the efficiency slide set must trace directly to the revenue recognition system and the GL. Analysts will ask for the source data. Founders who produce source data within 24 hours of a request protect the credibility of every metric in the deck.
Founders who want a structured view of how their raise package holds up against institutional standards before going to market should review what ten common mistakes kill a first institutional raise, including the ones that surface specifically in the efficiency section of diligence.
{{main-cta}}
Framing an Efficiency Gap as a Diagnosed Pattern
Founders who surface an efficiency gap, explain the root cause, and show the resolution convert a potential deal risk into a proof point of operational judgment.
The Disclosure Framework
Analysts expect to find imperfections at the $10M to $30M ARR stage. The companies that close rounds cleanly are those that get ahead of the narrative. The framework is three parts:
- Name the gap. State the metric, the current level, and the relevant benchmark. Do not wait for the analyst to find it.
- Diagnose the root cause. Was it a channel mix shift? A ramp cohort of new sales hires? A deliberate trade-off to prioritize enterprise ACV over SMB volume? The more specific the diagnosis, the more credible the founder appears.
- Show the action and the result. What changed operationally, when did it change, and what has the metric done since? A Magic Number that moved from 0.55 to 0.82 over two quarters, with a clear explanation of what drove the improvement, is a stronger signal than a static 0.9 with no story behind it.
What Analysts Actually Model
ICONIQ Growth's 2024 report notes that growth equity analysts build their own efficiency models before the first meeting, using public benchmarks and whatever data the founder has shared. The efficiency slide set is the founder's opportunity to frame the model inputs before the analyst fills them in with assumptions.
A founder who presents a recovering Magic Number with a clear diagnosis controls the narrative. A founder who presents a strong Magic Number with no segmentation gives the analyst a reason to build their own assumptions about what is inside the blended figure.
The principle: Investors fund trajectories. A metric moving in the right direction with a clear operational explanation is fundable. A metric at benchmark with no explanation of how it got there and no evidence it will stay there is a risk.
Founders approaching a Series B should understand the full scope of what growth equity diligence covers beyond efficiency metrics. The guide on how to raise capital for a Series A round in 2026 provides context on the progression of investor scrutiny from Series A through growth equity.
Frequently Asked Questions
What is the Magic Number formula and how do growth equity analysts apply it at Series B?
The Magic Number equals net new ARR in the current quarter divided by total sales and marketing spend in the prior quarter. ICONIQ Growth's 2024 benchmarks treat 0.75 as the acceptable floor at the $10M to $30M ARR stage, with top-quartile companies reaching 1.0 to 2.0. Analysts use it to determine whether adding capital to the GTM motion will produce proportional ARR or simply increase burn.
How do analysts interpret a Magic Number below 0.75 during Series B diligence?
A Magic Number below 0.75 triggers a segmentation request. Analysts want to see the metric broken out by acquisition channel and GTM motion to determine whether the blended number reflects a structural problem or a channel mix issue. According to ICONIQ Growth's GTM benchmark data, a blended number below threshold that includes a high-performing enterprise motion alongside a deprecated SMB channel is a diagnosable and manageable pattern when presented proactively.
What CAC payback period do growth equity firms expect at Series B for mid-market SaaS?
OpenView Partners' 2024 SaaS Benchmarks place the acceptable range for mid-market SaaS (ACV of $15K to $100K) at 14 to 18 months at the Series B stage. Payback periods above 24 months at any ACV segment are treated as a red flag requiring a detailed CAC efficiency audit before a term sheet conversation proceeds.
What LTV:CAC ratio do growth equity investors require before writing a Series B term sheet?
A ratio below 3:1 requires gross revenue retention above 85% as a compensating factor. Top-quartile companies at the Series B stage run 4:1 to 6:1, with enterprise SaaS companies trending toward 4.5:1 or above due to larger ACV and lower churn rates.
Can a company with a strong LTV:CAC ratio still face Series B valuation compression?
A strong LTV:CAC ratio paired with a CAC payback period above 24 months produces valuation compression regardless of the ratio level. The ratio measures long-run economics; the payback period measures short-run cash risk. Analysts price both.
How should founders present efficiency metrics when one GTM channel is underperforming?
Present the blended metric, then the channel-level breakdown, then the diagnosis and the action taken. KeyBanc's 2024 SaaS Survey found that founders who surface efficiency gaps proactively and explain the operational response move through diligence faster and receive fewer follow-up information requests. The goal is to frame the gap as a diagnosed and addressed pattern before the analyst identifies it independently.
What gross margin assumption should founders use when calculating LTV for a Series B efficiency presentation?
Analysts at growth equity firms will check the assumption explicitly. A revenue-based LTV calculation overstates the ratio materially and creates a credibility problem when the model is reviewed.
Continue reading this series:
- Founder Ownership Standards Before a Series B Close
- What Do Series B Growth Equity Investors Look for in a Company?
- Revenue-Quality Issues That Can Cause Growth Equity Investors to Pass on a Series B Deal
The Capital Raise Pre-Flight is IRC Partners’ fixed-fee diagnostic that scores a raise against the same twelve institutional gates a deal must clear before IRC Partners takes it into a strategic partnership. It is where every engagement begins, whether you are pre-revenue building toward a first institutional round or scaling a company that has raised before. For deals that clear, the full strategic partnership follows. IRC Partners advises operators raising $5M to $250M of institutional capital. If you are taking a raise to market, start here.
Need guidance on your capital raise?


What Blue Sky Laws Apply to a Real Estate Fund Raising Capital From Pension Funds Across Multiple States?
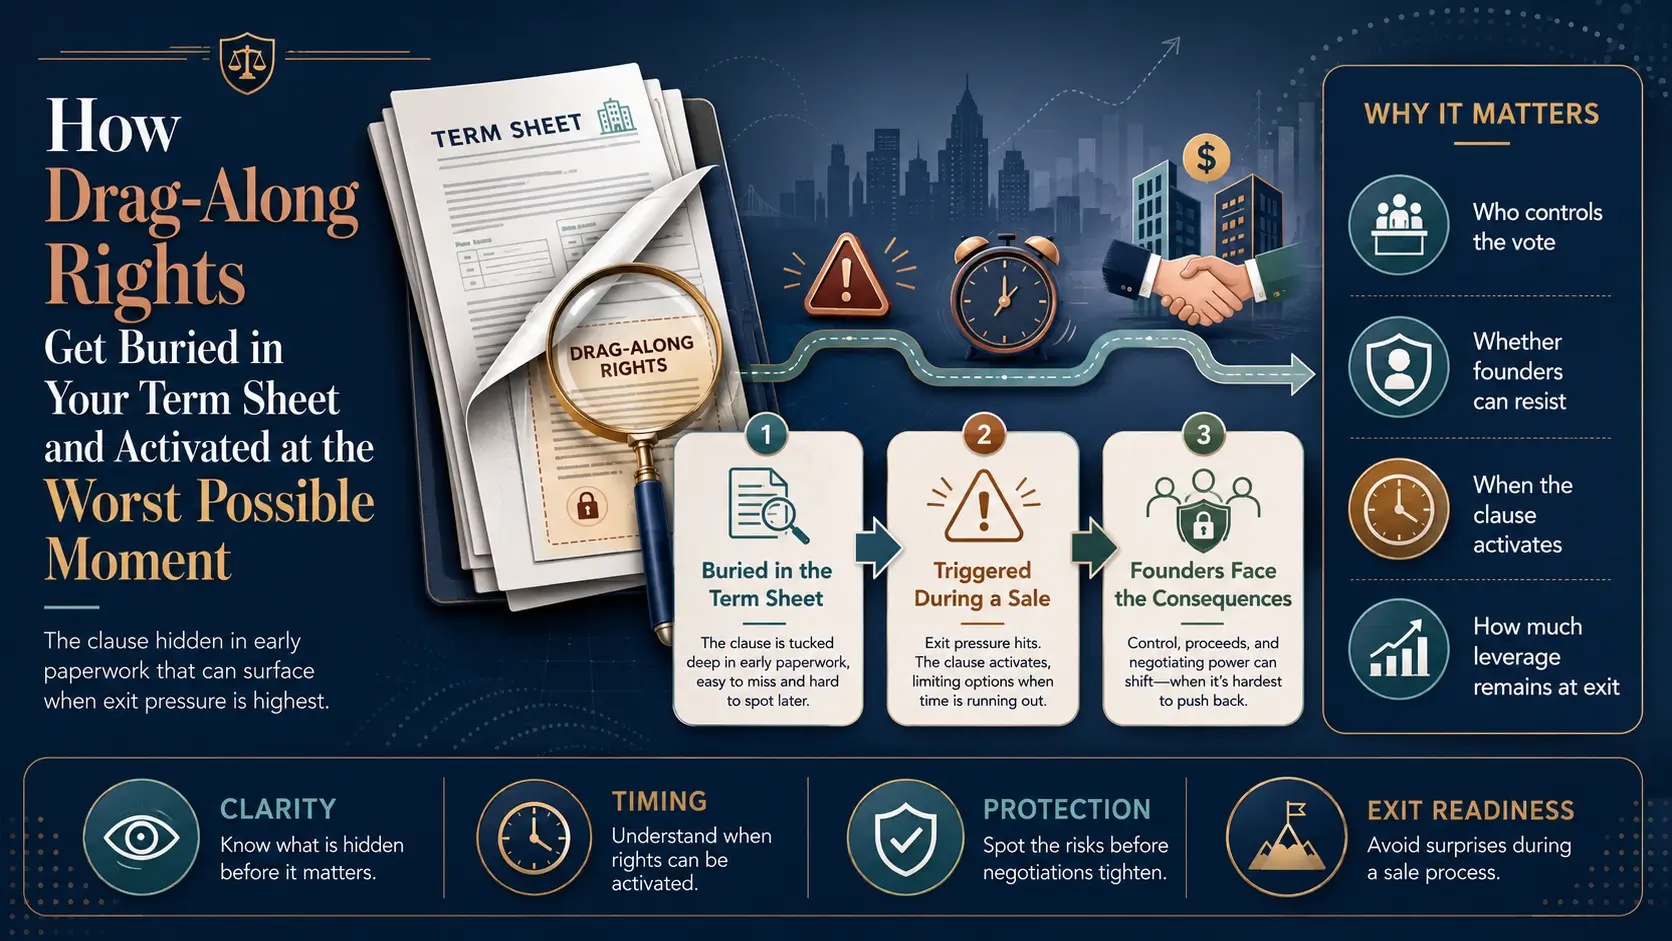
How Drag-Along Rights Get Buried in Your Term Sheet and Activated at the Worst Possible Moment

Common Mistakes Companies Make in Investor Relations Management for Growth Companies
Disclosure
Nothing on this site constitutes an offer to sell, or a solicitation of an offer to purchase, any security under the Securities Act of 1933, as amended, or any applicable state securities laws. Any offering of securities is made only by means of a formal private placement memorandum or other authorized offering documents delivered to qualified investors.
IRC Partners is a capital advisory firm. IRC Partners is not a registered investment adviser under the Investment Advisers Act of 1940 and does not provide investment advice as defined thereunder.
Certain statements in this article may constitute forward-looking statements, including statements regarding market conditions, capital availability, investor demand, and transaction outcomes. Such statements reflect current assumptions and expectations only. Actual results may differ materially due to market conditions, regulatory developments, company-specific factors, and other variables. IRC Partners makes no representation that any outcome, return, or result described herein will be achieved.
References to prior mandates, transaction volume, network credentials, or capital raised are provided for illustrative purposes only and do not constitute a guarantee or prediction of future results. Past performance is not indicative of future outcomes. Individual results will vary. Network credentials and transaction statistics referenced on this site reflect the aggregate experience of IRC Partners' principals and affiliated advisors and are not a representation of assets managed or transactions closed solely by IRC Partners.
Certain data, statistics, and information presented in this article have been obtained from third-party sources. IRC Partners has not independently verified such information and expressly disclaims responsibility for its accuracy, completeness, or timeliness. Readers should independently verify any third-party data before relying on it.
Readers are strongly encouraged to consult qualified legal, financial, and tax professionals before making any investment, capital raising, or business decision.
Schedule A Meeting
You get one shot to raise the right way. If this raise is worth doing, it’s worth doing with precision, leverage, and control.
This isn’t a practice run. Serious capital. Serious strategy. Let’s raise it right.
We onboard a maximum of seven
new strategic partners each quarter, by application only, to maximize your chances of securing the capital you need.
