.svg "CTA Arrow")


.png "Investor Ready Capital decorative background element")

What Do Series B Growth Equity Investors Look for in a Company?

Series B growth equity investors look for a business that can scale predictably, not just grow quickly. They test revenue quality, retention, unit economics, repeatable sales execution, margins, leadership depth, capital structure, and the path to a market large enough to support $100M ARR.
The shift from Series A to Series B is a shift in the question. At Series A, investors evaluated whether the product works and whether customers will pay.
According to Bessemer Venture Partners' State of the Cloud, the transition from founder-led sales to a repeatable, multi-rep sales motion is the defining operational threshold between Series A and Series B. Revenue is evidence. Repeatability is the investment thesis.
This guide covers what growth equity investors actually examine across each category, the specific benchmarks they use, and how to prepare each dimension before the first meeting. The sections below go deeper on each metric: customer concentration risk, SaaS cohort retention, sales efficiency, CAC payback, gross margin expansion, and more.
Here's what growth equity investors look for, category by category.
The ARR and Growth Rate Threshold
Growth equity investors fund ARR relative to its base. A company growing 80% from $5M ARR and a company growing 80% from $25M ARR are in very different positions, even though the growth rate is identical.
According to the KeyBanc Capital Markets SaaS Survey, the median Series B company in 2024-2025 entered its raise at approximately $26M ARR. That is the median. The credible floor sits at $8M to $10M ARR, with the most competitive rounds clustering between $15M and $30M.
Growth Rate Expectations by ARR Band
The growth rate bar adjusts as the ARR base grows. ICONIQ Growth's data sets the following expectations:
A company at $30M ARR growing 55% with clean efficiency metrics closes faster than a company at $30M ARR growing 80% with a deteriorating burn profile. Efficiency metrics gate whether the round happens at all.
Founders who enter a Series B process without modeling their growth rate in the context of their ARR base often misprice their own round. Investors do this calculation in the first meeting.
Net Revenue Retention: The Ceiling on Your Valuation
Net revenue retention (NRR) is the single number growth equity investors use to evaluate the durability of a business. It captures expansion, contraction, and churn in one figure. A company with 120% NRR is growing its existing customer base by 20% per year without acquiring a single new logo.
According to OpenView's SaaS Benchmarks report, NRR above 105% is the competitive floor at Series B. Top-quartile companies run 110% to 120% per OpenView's annual benchmarks. NRR above 120% is elite and can partially offset a lower growth rate in the valuation discussion.
The GRR-NRR Split
Investors look at both gross revenue retention (GRR) and net revenue retention (NRR) because NRR can mask churn through expansion. A company with 130% NRR but 75% GRR has a serious underlying churn problem that expansion revenue is covering up. Investors will find it.
Per KeyBanc's annual SaaS survey, the benchmarks are:
- GRR floor: 85% (below this is a structural warning)
- GRR strong: 90%+
- GRR elite: 93%+
The investor's logic: NRR compounds. A company at 120% NRR doubles its existing revenue base every 3.8 years without acquiring a new customer. That math is what drives the valuation premium. Per ICONIQ Growth's data, companies above $15M ARR where expansion revenue represents 40% or more of total growth are viewed favorably because the sales motion relies less on new logo velocity, which becomes harder to sustain at scale.
NRR below 100% is a pre-raise fix. A business at that level is shrinking its existing customer base and the sales team is running to stand still.
For a deeper look at how investors screen revenue quality and ownership risk before the first meeting, see how over-diluted founders trigger Series B pass letters before a single meeting.
Unit Economics: CAC Payback and the Burn Multiple
Unit economics at Series B are a proof layer. Investors are asking one question: does each dollar of sales and marketing spend reliably turn into ARR at an acceptable cost, and how long does it take to recover?
CAC Payback Period
According to the OpenView SaaS Benchmarks report, CAC payback below 18 months is the target for product-led growth companies at Series B. For sales-led companies, below 24 months is acceptable. Companies above those thresholds should expect direct questions about GTM model fit before receiving term sheets.
The top-quartile bar is tighter. Per OpenView's SaaS Benchmarks report, top-quartile Series B companies recover customer acquisition costs in 12 to 15 months.
The formula matters: investors want gross-margin-adjusted CAC payback rather than blended. A company with 80% gross margins and a 20-month payback looks very different from a company with 50% gross margins and a 20-month payback.
The Burn Multiple
The burn multiple (net cash burned divided by net new ARR) is the efficiency benchmark that ICONIQ Growth's 2024 report calls a first-order diligence question at Series B and Series C. The benchmarks:
Per ICONIQ Growth's 2024 SaaS metrics research, the median burn multiple for top-quartile performers compressed from 2.1x in 2021 to 1.3x in 2024. The post-2022 market reset permanently shifted institutional expectations toward capital efficiency. Founders who built in the 2020-2021 environment and have not recalibrated their burn assumptions will face friction in the current process.
A company at 1.2x burn and 65% growth presents a cleaner story than one at 2.5x burn and 90% growth. Investors price both the growth rate and the cost of generating it.
For founders who want to understand how capital structure affects the burn multiple calculation, the cap table cleanup guide for Series B covers the structural issues investors flag before they even read the deck.
Go-to-Market Efficiency: The Magic Number and Sales Repeatability
The go-to-market section of Series B diligence is where most founders underestimate the depth of investor scrutiny. Revenue numbers show investors what happened. GTM metrics show whether it will keep happening.
The Magic Number
The magic number measures how much new ARR a company generates for every dollar spent on sales and marketing. The formula: new ARR added in a quarter, divided by sales and marketing spend in the prior quarter.
Per Bessemer Venture Partners' State of the Cloud report, a magic number above 0.75 indicates acceptable GTM efficiency at Series B. Above 1.0 signals the company should be investing more aggressively in sales and marketing. Below 0.5 is a signal to pull back on growth spend and improve the motion before scaling.
According to Bessemer Venture Partners' State of the Cloud, the median magic number at Series B sits at approximately 0.81, reflecting companies that have moved beyond founder-led sales into a documented, multi-rep motion. Top-quartile performers consistently exceed 1.0.
Sales Repeatability: The Harder Test
The magic number is a lagging indicator. What investors probe more deeply is whether the sales motion works without the founders in the room.
According to Bessemer Venture Partners' State of the Cloud, a documented, multi-rep sales motion is the operational bar that separates fundable Series B companies from those still in founder-led mode. The specific tests investors apply:
- Have at least three sales reps (not the founders) completed the full sales cycle successfully?
- Is the win rate stable across those reps, by segment and by deal size?
- Does the company have a VP of Sales who has previously built a team from 5 to 25 reps?
- Are there second-line managers in place, or in the near-term hire plan?
Investors also examine pipeline coverage. Per Bessemer Venture Partners' GTM benchmarks, the standard is 3x to 4x coverage of the quarterly target. A company with $5M in quarterly ARR targets and $8M in pipeline is running thin. A company with $18M in pipeline against the same target has room to absorb slippage.
Forecast accuracy rounds out the GTM picture. Investors ask for historical forecast-to-actual comparisons across at least four to six quarters. A company that consistently calls its number within 10% is demonstrating operational discipline. A company that misses by 40% in two of the last four quarters has a forecasting problem, and investors will assume the Series B projections carry the same risk.
The Rule of 40: The Efficiency Benchmark That Prices the Round
The Rule of 40 is the efficiency benchmark Bessemer, ICONIQ, and most growth equity investors use to evaluate whether a company is growing sustainably. The calculation: growth rate plus free cash flow margin. A combined score above 40 is the target.
The Rule of 40 matters because it captures the trade-off between growth and profitability in a single number. A company growing at 60% with a -20% FCF margin scores 40. A company growing at 30% with a 10% FCF margin also scores 40. Investors weight both profiles, but the growth-heavy version requires confidence in the efficiency trajectory.
What the Score Signals at Series B
Per the Bessemer Cloud 100 Benchmarks Report, companies with a Rule of 40 score above 40 trade at 7x to 15x ARR. Companies below 20 compress to 2x to 4x ARR. That spread translates directly into dilution at close.
The distribution of Rule of 40 scores among Series B companies, according to Bessemer Venture Partners' BVP Atlas data:
A company scoring 35 on the Rule of 40 is competitive but will face questions about the efficiency trajectory. Investors want to see the trend improving, not flat. A company that scored 28 eighteen months ago and 35 today has a better story than a company that scored 38 eighteen months ago and 35 today, even though the current number is the same.
The Capital Raise Pre-Flight is IRC Partners' fixed-fee diagnostic that scores a raise against the same twelve institutional gates a deal must clear before IRC Partners takes it into a strategic partnership.
Founders preparing for a Series B who want to understand how their Rule of 40 profile compares to the institutional bar, and where the structural gaps are, can start with that diagnostic before going to market.
Gross Margin: The Floor That Determines Your Multiple
Gross margin at Series B gets scrutinized in ways it did not at Series A. Investors are now underwriting a scaled business, and gross margin is the ceiling on how much of each revenue dollar can flow to the bottom line.
According to the KeyBanc SaaS survey, subscription gross margin benchmarks at Series B sit at:
- Acceptable: 70%+
- Strong: 75-80%
- Elite: 80%+
Per KeyBanc's annual SaaS survey, the median Series B company runs 75% to 78% gross margin. Below 65% raises questions about whether the SaaS economics are structurally sound. Above 85% is uncommon and typically signals very low support costs or a product architecture that does not require significant infrastructure spend.
The AI-Native Margin Problem
For AI-native products, gross margin scrutiny intensified in 2025 and 2026. Per ICONIQ Growth's 2024 SaaS Metrics Report, inference costs in AI-native products can consume 15 to 20 points of gross margin that would otherwise be visible on a traditional SaaS P&L. Investors building models for AI-native Series B companies are adjusting their gross margin assumptions downward and asking for COGS breakdowns that isolate compute costs from other cost of revenue.
Founders with AI-native products should prepare a COGS breakdown that shows:
- Hosting and infrastructure costs per customer or per active user
- Inference costs as a percentage of revenue, trended by quarter
- The gross margin trajectory as the company scales (does it improve with scale, or compress?)
A company at 68% gross margin with a clear path to 78% over the next 18 months is a better story than a company at 73% gross margin that has been flat for six quarters.
Founders preparing a gross margin expansion narrative for their Series B process should build it around demonstrated unit-level improvements, with quarter-over-quarter COGS data to support the trajectory.
Team Scalability: What Investors Assess Beyond the Org Chart
The question growth equity investors bring to every Series B team assessment is whether the current leadership can manage a company three times larger.
The Founder-Dependence Test
The same principle that drives GTM scrutiny extends across every function. Investors assess whether each department would continue to operate effectively if the CEO stopped attending its weekly team meeting.
Investors apply a specific test to each function: would this function continue to operate effectively if the CEO stopped attending its weekly team meeting? If the answer is yes, the function is institutionally ready. If the answer is no, the investor is buying founder-dependency risk.
The specific team markers investors look for at Series B:
- VP of Sales: Has this person built a team from 5 to 25 reps before? A VP who has only operated at 3 to 7 reps is a scaling risk at Series B.
- VP of Marketing: Can they operate pipeline generation independently? Is marketing-sourced pipeline growing as a percentage of total pipeline?
- VP of Product: Is product roadmap driven by customer data and market analysis, or by founder instinct?
- Second-line managers: At Series B, investors are scaling into the management layer below the VPs. Those managers need to exist or be in the near-term hire plan.
The Operating Cadence Signal
Investors also assess the operating cadence the company runs. A company with a weekly pipeline review, a monthly business review with board-ready metrics, and a quarterly planning process is demonstrating institutional-grade management infrastructure. A company where the founder reviews pipeline in their head and sends board updates as narrative emails is demonstrating the opposite.
Growth equity investors expect the operating cadence to be in place before they invest.
For founders who want to understand how their team and governance structure will be evaluated in the data room, the phantom equity and non-standard instruments guide for Series B covers how investors evaluate governance complexity alongside team structure.
Capital Structure and the Data Room
Growth equity investors run metrics diligence and capital structure diligence in parallel. A company with strong ARR, clean retention, and a messy cap table will stall in diligence while legal teams work through structural problems that should have been fixed before the process started.
What Investors Flag in the Cap Table
The cap table issues most likely to create friction at Series B are well-documented. Stacked SAFEs and convertible notes that inflate fully diluted share counts beyond what founders report, investor consent rights that block the new round from closing, board composition that gives legacy investors veto power over incoming terms, and documentation defects that raise title and governance risk.
The standard pre-raise checklist investors expect founders to have completed:
- A current, fully diluted cap table showing ownership on an as-converted basis, including all SAFEs, notes, warrants, option pool (granted and ungranted), and reserved shares
- Reconciled legal documents for every equity issuance, option grant, and convertible instrument
- Modeled note conversion at three valuation scenarios: target, 20% above, and 20% below
- Confirmation that founder ownership post-close clears the threshold target investors typically require
Uncapped convertible notes from seed rounds are a specific red flag. The uncapped convertible note overhang guide covers how to model that problem and present it to investors before they find it themselves.
The Data Room Standard
Institutional investors at Series B expect a data room that is built before the first meeting. Founders who want a step-by-step framework for building a data room that closes institutional investors will find the folder structure and staged disclosure model covered in detail. The standard data room includes financial statements for 24 months, a clean cap table with no unexplained instruments, customer cohort data and churn analysis, product roadmap and technical documentation, legal structure and IP registrations, and all contracts.
The most common data room mistakes that stall Series B processes are missing cohort data, unreconciled cap table instruments, and financial statements that stop at 12 months instead of 24.
Market Sizing and the Path to $100M ARR
Series B investors are writing a check sized for a company that can reach $100M ARR or more. If the total addressable market does not support that outcome, the round does not close at growth equity terms. Market sizing is an underwriting input.
What Investors Reject in Market Sizing
The top-down TAM slide ("the global market is $50B, we need 1%") signals a founder who skipped the analytical work growth equity investors require. Growth equity investors want bottom-up market sizing that shows the actual number of reachable customers, their average contract value, and the math that gets the company to $100M ARR from the current base.
The specific questions investors apply to market sizing at Series B:
- How many companies fit the ICP, defined with specifics (company size, industry, tech stack, buying trigger)?
- What is the average contract value for that segment, and what is the expansion ceiling per account?
- How many of those companies are reachable with the current GTM motion in the next 24 months?
- What is the market penetration rate today, and what does it need to be at $100M ARR?
A credible market sizing analysis at Series B shows a path to $100M ARR that requires capturing a small percentage of a large, defined market, with the GTM capacity to reach that market within the capital deployment window.
The Expansion Revenue Test
The market sizing analysis should connect the expansion opportunity to the TAM. If the ICP has 500 reachable accounts and the average fully-expanded contract value is $200,000, the expansion ceiling is $100M from the current ICP alone. That is a different story than a market where expansion is capped at $25,000 per account and new logo acquisition is the only path to scale.
For a full walkthrough of how to structure the market sizing section of a Series B raise, the guide to raising capital for a startup in 2026 covers how investors evaluate market opportunity across funding stages.
{{main-cta}}
What Founders Should Do Before the First Meeting
The companies that close Series B rounds cleanly share one characteristic: they did the preparation work before the process started. The diligence request list from a growth equity investor is predictable. The structural issues they will flag are documented. The only variable is whether the founder has addressed them in advance or is discovering them under time pressure during a live process.
The Pre-Raise Preparation Sequence
The sequence that institutional-ready companies follow before going to market:
- Build the metrics package. Assemble month-by-month ARR, NRR, GRR, CAC payback by segment, burn multiple by quarter, magic number by quarter, and Rule of 40 trend. This is the investor's first diligence request. Have it ready before the first meeting.
- Audit the cap table. Run the fully diluted model. Model note conversions at three valuation scenarios. Identify any consent rights, veto rights, or documentation defects. Fix structural problems before outreach.
- Assess the GTM motion. Confirm that at least three non-founder reps have completed the full sales cycle. Document win rates by segment and by rep. Build the pipeline coverage analysis.
- Prepare the data room. Build it before the first meeting. Index every document. Confirm that financial statements, customer cohort data, cap table, contracts, and legal structure are complete and labeled.
- Score the raise against institutional gates. Scoring the raise against the twelve institutional gates before going to market is the difference between a clean process and a stalled one.
Growth equity investors at Series B are underwriting a company at scale. Every metric, every document, and every structural element of the raise should reflect the discipline of a company that has already crossed that threshold.
Frequently Asked Questions
What ARR do you need to raise a Series B from a growth equity firm?
The credible floor is $8M to $10M ARR, per KeyBanc Capital Markets Series B readiness benchmarks. The median Series B company enters the process at approximately $26M ARR, per KeyBanc Capital Markets data. At $15M ARR and above, founders gain meaningful leverage in terms negotiations. Companies below $8M ARR raising at growth equity terms will face questions about stage fit before they get to metrics.
How do growth equity investors define revenue quality at Series B?
Revenue quality is evaluated across four dimensions: the GRR-NRR split, customer concentration, contract structure, and revenue predictability. Per OpenView's SaaS Benchmarks report, NRR above 105% is the competitive floor. Per KeyBanc's annual SaaS survey, GRR above 85% is the structural minimum. A company with 120% NRR and 70% GRR has a churn problem masked by expansion. Investors will model both numbers separately and weight GRR heavily in their durability assessment.
What burn multiple is acceptable for a Series B SaaS company?
According to ICONIQ Growth's 2024 report, a burn multiple below 1.5x combined with a magic number above 0.75 represents the preferred investment profile for growth-stage rounds. Below 1.0x is best-in-class. Between 1.5x and 2.0x is acceptable but will draw questions about the efficiency trajectory. Above 2.0x at Series B is a material red flag that compresses valuation multiples regardless of growth rate.
What does a growth equity investor mean by a non-founder-led sales motion?
A non-founder-led sales motion means at least three individual contributors outside the founding team have independently completed the full sales cycle, from prospecting through close. Bessemer Venture Partners' State of the Cloud identifies the transition away from founder-led sales as the defining operational threshold investors assess at Series B. The test is whether the sales function would continue to operate if the CEO stopped attending its weekly team meeting.
How is the Rule of 40 calculated and why does it matter at Series B?
The Rule of 40 is calculated as the company's YoY growth rate plus its free cash flow margin. A combined score above 40 is the target. Per Bessemer Venture Partners' BVP Atlas data, companies above 40 trade at 7x to 15x ARR. Companies below 20 compress to 2x to 4x ARR. The trend matters as much as the current score. A company improving from 28 to 35 over 18 months is a better story than one that has been flat at 38.
What gross margin do Series B growth equity investors expect for a SaaS company?
According to the KeyBanc SaaS survey, subscription gross margin above 70% is the acceptable floor at Series B. Strong companies run 75% to 80%. Elite companies exceed 80%. For AI-native products, per ICONIQ Growth's 2024 SaaS Metrics Report, investors adjust their expectations downward to account for inference costs that can consume 15 to 20 points of gross margin. Founders with AI-native products should prepare a COGS breakdown that isolates compute costs and shows the gross margin trajectory as the business scales.
How should founders present customer concentration risk in a Series B process?
Customer concentration becomes a diligence flag when any single customer represents more than 10% to 15% of ARR, a threshold consistently flagged in KeyBanc Capital Markets' annual SaaS survey as a structural risk at Series B. Growth equity investors model the revenue impact of losing the top one, two, and three customers and assess whether the remaining base supports the growth thesis. The presentation should show concentration by customer, by segment, and by contract renewal date, along with the ARR trend for the top accounts to demonstrate whether they are expanding or static.
Continue reading this series:
- What the Institutional Readiness Score measures and how the 85-point threshold is set
- How unperfected security interests create a Series B lender consent problem
- How should founders present pipeline coverage to growth equity investors?
The Capital Raise Pre-Flight is IRC Partners’ fixed-fee diagnostic that scores a raise against the same twelve institutional gates a deal must clear before IRC Partners takes it into a strategic partnership. It is where every engagement begins, whether you are pre-revenue building toward a first institutional round or scaling a company that has raised before. For deals that clear, the full strategic partnership follows. IRC Partners advises operators raising $5M to $250M of institutional capital. If you are taking a raise to market, start here.
Need guidance on your capital raise?


Super Pro-Rata Rights: How One Aggressive Seed Investor's Outsized Follow-On Allocation Is Crowding Out Your Series B Lead
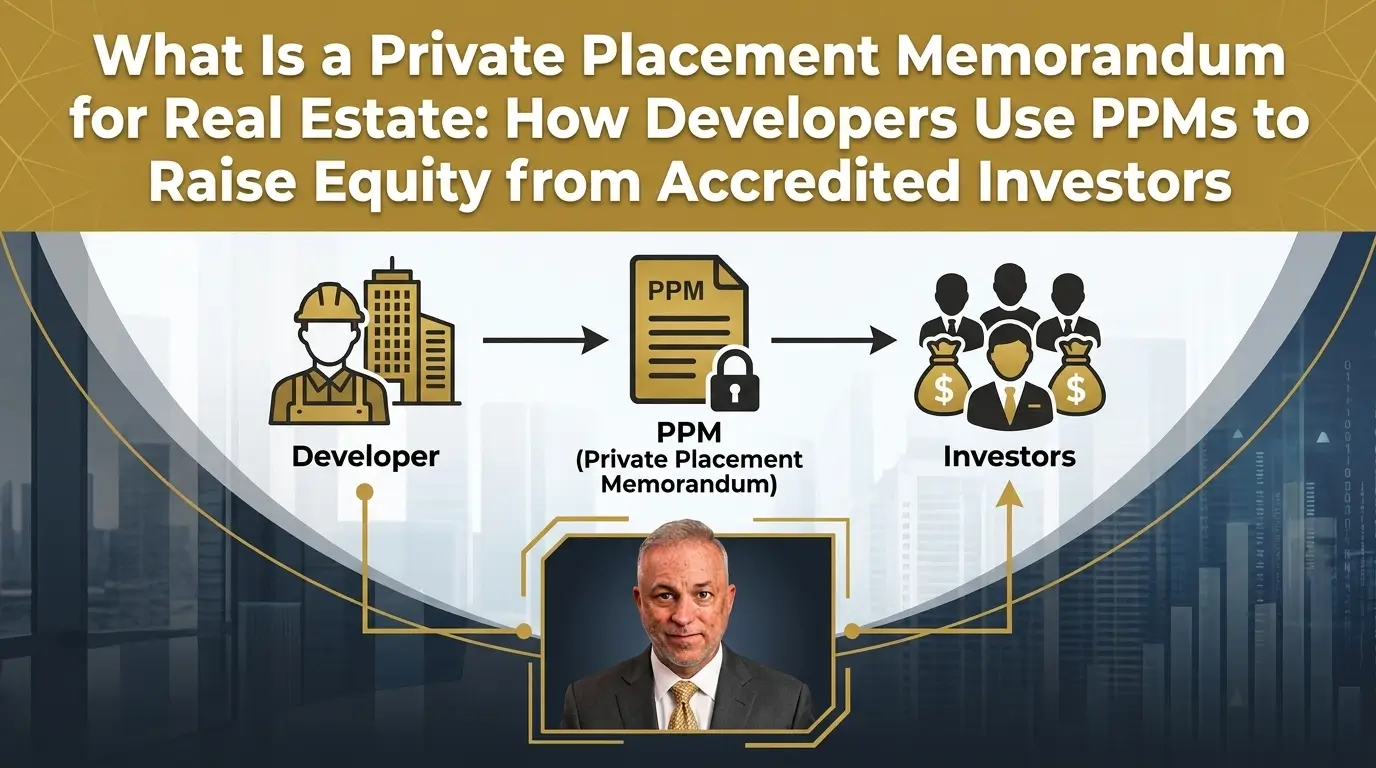
What Is a Private Placement Memorandum for Real Estate: How Developers Use PPMs to Raise Equity from Accredited Investors

Top Firms for Investor Pitch Deck Preparation
Disclosure
Nothing on this site constitutes an offer to sell, or a solicitation of an offer to purchase, any security under the Securities Act of 1933, as amended, or any applicable state securities laws. Any offering of securities is made only by means of a formal private placement memorandum or other authorized offering documents delivered to qualified investors.
IRC Partners is a capital advisory firm. IRC Partners is not a registered investment adviser under the Investment Advisers Act of 1940 and does not provide investment advice as defined thereunder.
Certain statements in this article may constitute forward-looking statements, including statements regarding market conditions, capital availability, investor demand, and transaction outcomes. Such statements reflect current assumptions and expectations only. Actual results may differ materially due to market conditions, regulatory developments, company-specific factors, and other variables. IRC Partners makes no representation that any outcome, return, or result described herein will be achieved.
References to prior mandates, transaction volume, network credentials, or capital raised are provided for illustrative purposes only and do not constitute a guarantee or prediction of future results. Past performance is not indicative of future outcomes. Individual results will vary. Network credentials and transaction statistics referenced on this site reflect the aggregate experience of IRC Partners' principals and affiliated advisors and are not a representation of assets managed or transactions closed solely by IRC Partners.
Certain data, statistics, and information presented in this article have been obtained from third-party sources. IRC Partners has not independently verified such information and expressly disclaims responsibility for its accuracy, completeness, or timeliness. Readers should independently verify any third-party data before relying on it.
Readers are strongly encouraged to consult qualified legal, financial, and tax professionals before making any investment, capital raising, or business decision.
Schedule A Meeting
You get one shot to raise the right way. If this raise is worth doing, it’s worth doing with precision, leverage, and control.
This isn’t a practice run. Serious capital. Serious strategy. Let’s raise it right.
We onboard a maximum of seven
new strategic partners each quarter, by application only, to maximize your chances of securing the capital you need.
