.svg "CTA Arrow")


.png "Investor Ready Capital decorative background element")

What are the Biggest Red Flags in a Series B SaaS Customer Cohort Analysis?

Series B investors look for five cohort red flags: deteriorating vintages, NDR compression, renewal-clustered expansion, early churn, and incomplete reporting. These patterns can hide behind healthy blended retention metrics while weakening an investor's view of product-market fit, expansion potential, and operating maturity. Identifying the source, documenting the remediation, and presenting clean cohort data before diligence lets founders address the risk directly.
ICONIQ Growth's 2025 State of Software report shows net dollar retention for B2B SaaS companies settling into the 110% to 120% range. Series B growth equity investors use cohort tables to verify whether a company's blended NDR reflects that range across every vintage, or whether aggregate health is masking vintage-level deterioration. Trained analysts read a cohort table the same way a radiologist reads a scan: they are looking for patterns the summary numbers hide.
The core problem: blended retention metrics can look healthy while individual cohort vintages are deteriorating. Investors disaggregate the data, and founders who read their own cohort table before the first meeting control the narrative.
This guide covers the five specific cohort red flags that stall or kill a Series B process, what each one signals to a growth equity investor, and the corrective steps available before diligence begins. Founders preparing for a raise at $10M to $30M ARR should work through each flag against their own data before the first meeting request goes out.
The Capital Raise Pre-Flight is IRC Partners' fixed-fee diagnostic that scores a raise against the same twelve institutional gates a deal must clear before IRC Partners takes it into a strategic partnership.
Red Flag 1: Vintage Deterioration
Vintage deterioration occurs when newer customer cohorts retain and expand at lower rates than older ones. Pull your cohort table and compare the 12-month NDR of customers acquired in your most recent four quarters against customers acquired in the four quarters before that. If the newer vintages are consistently lower, you have vintage deterioration.
Why investors treat this as a structural signal: a company with strong blended retention but declining cohort-level performance is burning through the goodwill of early customers while acquiring ones who fit less well. The 2025 KBCM Sapphire Ventures SaaS Survey shows median gross dollar retention at 85% in 2023, 86% in 2024, and 89% in 2025. Vintage deterioration in a company's own table while the market recovers is a direct ICP or onboarding drift signal.
What investors ask when they see it
- Has your ICP expanded or shifted since the company crossed $10M ARR?
- Did sales velocity increase without a corresponding investment in onboarding?
- Are the underperforming vintages concentrated in a specific segment, channel, or geography?
Corrective steps before diligence
- Segment the deteriorating vintages by acquisition channel and customer size to isolate the source.
- Prepare a written narrative explaining the variance. Investors expect founders to have already diagnosed it.
- If a deliberate ICP expansion caused the drift, show the new segment's early cohort data separately to demonstrate the expansion thesis has its own retention base.
A founder who diagnoses and explains this pattern with data controls the narrative. The investor who finds it first turns it into a process problem.
Red Flag 2: NDR Compression in Recent Cohorts
NDR compression is distinct from vintage deterioration. This flag appears when recent cohorts show a narrowing gap between gross retention and net retention, meaning expansion revenue is shrinking as a share of the base even while gross churn holds steady.
Why this matters at Series B: growth equity investors are buying an expansion engine. ICONIQ's Enterprise Five framework identifies NDR as one of the five most predictive indicators of long-term B2B SaaS value. The ICONIQ Enterprise Five table shows top-quartile NDR at 120% for companies in the $10M to $50M ARR range. When recent cohorts show NDR compressing toward the 100% to 105% range, investors model a future where new ARR growth is required just to offset base erosion, which changes the capital efficiency story materially.
The three compression patterns investors identify
Corrective steps before diligence
Segment cohort NDR by product line and expansion motion. If compression is concentrated in one motion (seats, usage, or cross-sell), the fix is specific. Present the segmented view in your data room with a written explanation of which motion is constrained and what the go-forward plan addresses.
Surfacing this analysis proactively signals the operational depth that Series B investors expect at this stage. Understanding how to raise capital for a startup through institutional channels helps frame what the cohort data must support.
Red Flag 3: Expansion Clustering at Renewal
Expansion clustering at renewal means that the majority of a cohort's upsell and expansion revenue arrives at the contract anniversary, with minimal mid-cycle expansion between renewals. On a monthly cohort chart, this appears as a flat line followed by a single spike at month 12, 24, or 36.
Why investors flag this: organic, mid-cycle expansion signals that customers are deriving ongoing value from the product. Renewal-concentrated expansion is a sales-driven event and introduces revenue predictability risk. Investors use expansion distribution timing as a product-led signal when modeling post-investment growth. Expansion arriving throughout the contract year indicates ongoing product value delivery. Renewal-concentrated expansion indicates a contract-driven event.
What the clustering pattern implies
- Expansion arrives at contract repricing. Customers expand because the contract requires it, with no behavioral signal that the product is generating ongoing value between renewals.
- Churn risk concentrates at renewal. If expansion only happens at renewal, so does the decision to leave.
- Sales team dependency. Expansion driven by account managers at renewal is harder to scale than product-led growth.
Corrective steps before diligence
Map expansion events by month relative to cohort start date. If the majority of expansion ARR clusters within 30 days of the contract anniversary, document the product and pricing changes underway to shift that distribution. Investors will ask. Having the answer prepared, with early data from any mid-cycle expansion motion already in place, changes the conversation from a risk discussion to a roadmap discussion.
Red Flag 4: Early Churn Concentration
Early churn concentration means a disproportionate share of customer cancellations occur in months one through six of the customer lifecycle. On a cohort retention curve, this shows as a steep initial drop followed by a flatter tail, which looks acceptable in aggregate but signals a specific failure point in onboarding or product activation.
Why this is a valuation problem: investors model customer lifetime value using cohort retention curves. A steep early drop compresses LTV regardless of how well later-stage customers retain. When early churn is concentrated, gross retention figures understate the health of the post-activation customer base while the onboarding failure rate stays hidden in the aggregate.
The diagnostic question
Calculate your cohort retention curve separately for months one through six and months seven through twenty-four. If the M1 to M6 loss rate is materially higher than the M7 to M24 annualized loss rate, early churn concentration is present.
What drives early churn and how to address it
Founders preparing for a Series B process should also review the full M&A and institutional diligence document checklist to confirm that 24 to 36 months of cohort-level churn data is organized and accessible before the first diligence request arrives.
Red Flag 5: Cohort Table Gaps and Data Management Problems
The fifth red flag lives in the shape, completeness, and consistency of the cohort table itself. Investors read data management quality as a proxy for operational maturity. A cohort table with missing vintages, inconsistent cohort definitions, or gaps in the middle of the data series tells the investor that the company lacks reliable internal reporting, which raises a separate set of questions about financial controls and data room integrity.
What constitutes a cohort table gap:
- Missing quarters in the vintage sequence, with no explanation in the data room
- Cohort definitions that change mid-table (monthly cohorts for some periods, quarterly for others)
- ARR figures that fail to reconcile with the financial statements provided separately
- Expansion and churn columns left blank for recent periods because the data remains unextracted from the billing system
Why this stalls a process
Growth equity investors at the Series B stage expect the founding team to have built internal reporting infrastructure before the raise. At that scale, cohort data should be a routine finance output, produced by the billing system on a regular cadence. At that stage, cohort data should be a routine finance output, produced by the billing system on a regular cadence.
The investor's logic: a company that struggles to produce clean cohort data before the raise will struggle to produce clean board reporting after it. That inference affects how much operational support the investor prices into the deal and how much they discount the valuation.
Corrective steps before diligence
- Audit the cohort table for completeness. Every quarter from company founding through the current period should have a row.
- Standardize cohort definitions in writing. Document whether cohorts are defined by contract start date, first invoice date, or first active use date, and apply that definition consistently.
- Reconcile the cohort ARR figures against the audited or reviewed financials. Any variance needs a written explanation.
- Build the cohort table as a live output from your billing system. A manual spreadsheet breaks under diligence pressure. Investors will ask how it is generated.
A clean, complete, and reconciled cohort table signals operational readiness that accelerates diligence and supports the valuation conversation. Building it under diligence pressure signals the opposite. For a full view of how cap table and structural readiness interact with cohort data in a Series B process, the structural screen happens before the cohort table is ever opened.
{{main-cta}}
How Each Red Flag Affects Valuation and Deal Terms
Cohort red flags do not always kill a Series B process. They change the terms. Understanding the mechanics helps founders prioritize which flags to address first.
Key principle: investors price risk they can see. An unexplained red flag becomes a valuation discount. One with a clear diagnosis and a credible remediation plan becomes a diligence question that gets answered and closed.
The valuation and terms impact by flag type
ICONIQ Growth's Enterprise Five research identifies NDR as one of the strongest indicators of long-term software company value. Companies with NDR above 115% sustain higher ARR multiples because the investor's model shows the base growing without requiring proportional new customer acquisition spend. Every point of NDR compression below that threshold affects the multiple the investor is willing to pay.
The practical implication: a founder who resolves two or three of these flags before the first meeting arrives at that meeting with data that supports a higher multiple. That is a material difference in outcome at the $10M to $30M ARR stage.
Frequently Asked Questions
What is the minimum NDR a Series B investor expects to see in a SaaS cohort table?
Series B growth equity investors use the ICONIQ Growth benchmark of 110% to 120% NDR as the healthy range, with top-quartile companies in the $10M to $50M ARR stage reaching 120% per the ICONIQ Enterprise Five table. A blended NDR below 105% triggers a deeper cohort-level review. The more important signal is the direction of recent cohort NDR: a company at 108% blended with improving recent vintages is a stronger story than one at 112% blended with compressing recent cohorts.
How many quarters of cohort data do Series B investors typically request?
The standard request is eight to twelve quarters of cohort data, covering both a customer retention table and a revenue retention table. Series B investors expect at least two full years of cohort history with consistent cohort definitions across the entire period.
Can a founder address vintage deterioration after the first investor meeting?
Vintage deterioration discovered during diligence is harder to address than deterioration a founder diagnoses and explains proactively. The corrective work, segmenting by channel, documenting ICP changes, and showing early data from any remediation effort, takes time. Founders who identify the flag three to six months before outreach have enough runway to build a credible narrative with supporting data. Founders who discover it in diligence arrive at that conversation defending a problem.
What does expansion clustering at renewal tell an investor about product-market fit?
It tells them that value delivery is episodic, arriving in contract-driven bursts with no signal of ongoing product engagement between renewals. Organic mid-cycle expansion, where customers add seats or usage between contract anniversaries, signals that the product is generating ongoing value that customers are willing to pay for without a sales prompt. Renewal-clustered expansion signals that the expansion decision is contract-driven.
How do cohort table gaps affect the diligence timeline?
A cohort table with missing vintages, inconsistent definitions, or ARR figures that do not reconcile with financial statements triggers a broader data room audit. That audit adds weeks to the diligence timeline and signals to the investor that financial controls may need strengthening post-close.
What is the difference between gross dollar retention and net dollar retention in a cohort context?
Gross dollar retention (GDR) measures the percentage of beginning-period ARR retained after removing churn and downsell, with no credit for expansion. Net dollar retention (NDR) adds expansion revenue back. KeyBanc Capital Markets and Sapphire Ventures report median GDR at 89% and median NDR at 102% for private SaaS companies in 2025. In a cohort table, the gap between GDR and NDR within each vintage reveals how much expansion is covering churn. A narrowing gap in recent cohorts is the NDR compression signal that investors watch most closely.
Should a founder present cohort data in the pitch deck or wait for diligence?
A summary cohort view belongs in the data room, accessible before the first deep-dive meeting. The pitch deck should reference cohort health directionally, for example citing NDR and gross retention at the company level, but the detailed vintage-by-vintage table is a diligence document. Founders who make the cohort summary available early, before it is requested, signal data confidence and operational readiness. Investors who ask for basic retention data twice form a negative inference about what else may be missing.
Continue reading this series:
- When to Hire Venture Capital Fundraising Advisory
- Series A Valuations: How to Calculate Your Raise and What Investors Look For
- What Series B growth equity investors look for in a company
The structure you carry into your first investor meeting sets the terms for every round that follows it. Founders who get it wrong spend the next three rounds negotiating from behind. The Capital Raise Pre-Flight is IRC Partners’ fixed-fee diagnostic that scores a raise against the same twelve institutional gates a deal must clear before IRC Partners takes it into a strategic partnership. IRC Partners advises operators raising $5M to $250M of institutional capital. Book your Capital Raise Pre-Flight here.
Need guidance on your capital raise?



Phantom Equity and SARs: How Non-Standard Equity Instruments Create Series B Valuation and Governance Confusion
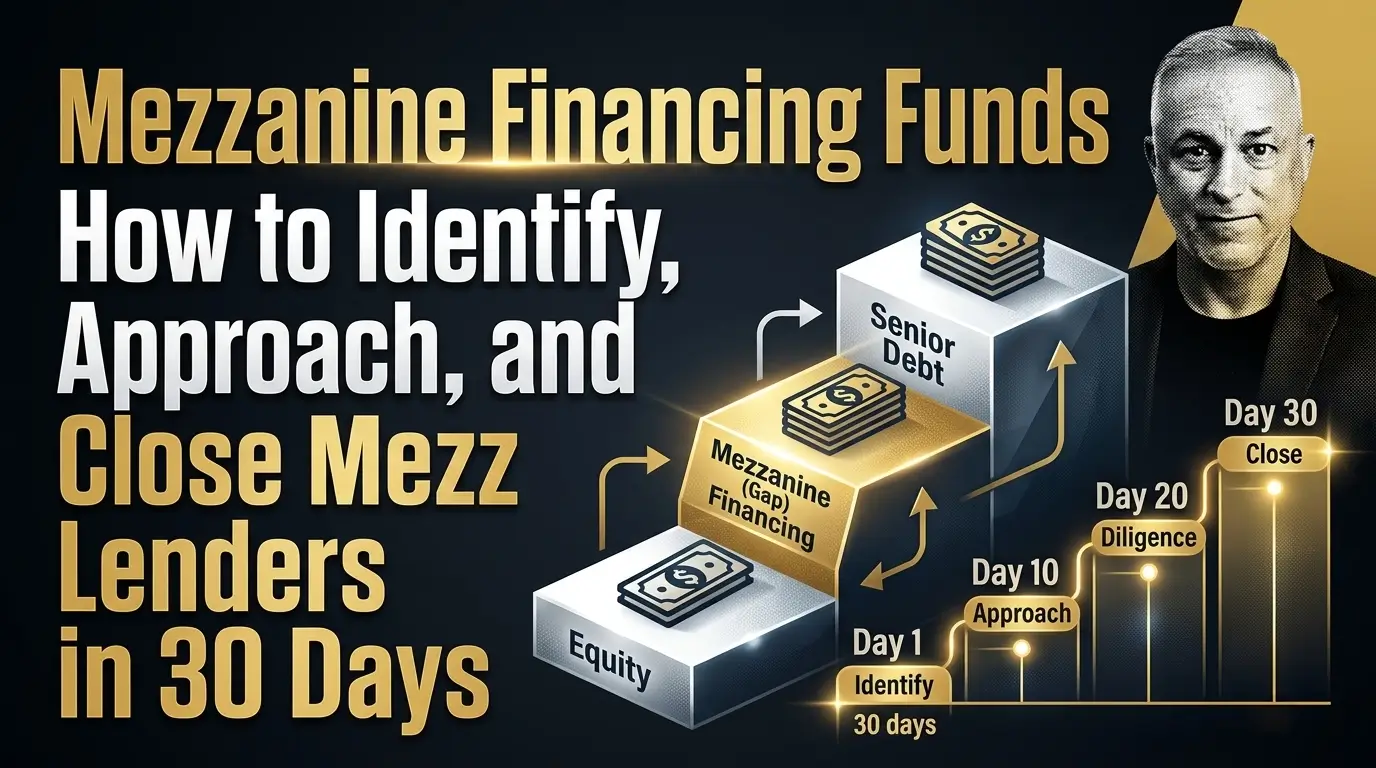
Mezzanine Financing Funds: How to Identify, Approach, and Close Mezz Lenders in 30 Days

Best Advisors for Sovereign Wealth and Pension Capital
Disclosure
Nothing on this site constitutes an offer to sell, or a solicitation of an offer to purchase, any security under the Securities Act of 1933, as amended, or any applicable state securities laws. Any offering of securities is made only by means of a formal private placement memorandum or other authorized offering documents delivered to qualified investors.
IRC Partners is a capital advisory firm. IRC Partners is not a registered investment adviser under the Investment Advisers Act of 1940 and does not provide investment advice as defined thereunder.
Certain statements in this article may constitute forward-looking statements, including statements regarding market conditions, capital availability, investor demand, and transaction outcomes. Such statements reflect current assumptions and expectations only. Actual results may differ materially due to market conditions, regulatory developments, company-specific factors, and other variables. IRC Partners makes no representation that any outcome, return, or result described herein will be achieved.
References to prior mandates, transaction volume, network credentials, or capital raised are provided for illustrative purposes only and do not constitute a guarantee or prediction of future results. Past performance is not indicative of future outcomes. Individual results will vary. Network credentials and transaction statistics referenced on this site reflect the aggregate experience of IRC Partners' principals and affiliated advisors and are not a representation of assets managed or transactions closed solely by IRC Partners.
Certain data, statistics, and information presented in this article have been obtained from third-party sources. IRC Partners has not independently verified such information and expressly disclaims responsibility for its accuracy, completeness, or timeliness. Readers should independently verify any third-party data before relying on it.
Readers are strongly encouraged to consult qualified legal, financial, and tax professionals before making any investment, capital raising, or business decision.
Schedule A Meeting
You get one shot to raise the right way. If this raise is worth doing, it’s worth doing with precision, leverage, and control.
This isn’t a practice run. Serious capital. Serious strategy. Let’s raise it right.
We onboard a maximum of seven
new strategic partners each quarter, by application only, to maximize your chances of securing the capital you need.
